In the fall of 2025, AWC surveyed Washington’s cities and towns to learn about current city conditions. Here’s a snapshot of what we found.
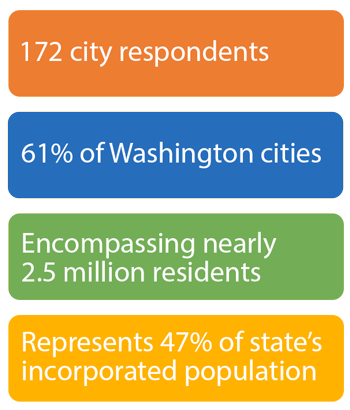
Who took the survey?
Key takeaways
- Infrastructure continues to dominate city needs. Preservation and maintenance of local infrastructure and transportation systems remain vital as those systems continue to age and require ever-present investment. More investment and partnerships are needed.
- Concerns over budgets and financial challenges continue an upward trend. Cities face ongoing structural issues where city revenues are outpaced by increasing costs of goods and services, creating growing concerns about their ability to keep up with community needs. Cities need flexible, sustainable, and reliable revenue options and ongoing direct funding from the state to meet the needs of their unique communities.
- Housing affordability remains a focus. State funding is the one consistent thing cities point to as a way to spur additional affordable housing development.
- Despite improvement in overall crime statistics, cities cite public safety challenges. Funding continues to be a challenge as new resources from the state via HB 2015 are slow to materialize. The challenges are exacerbated by new impacts from increased public defense mandates.
General city conditions
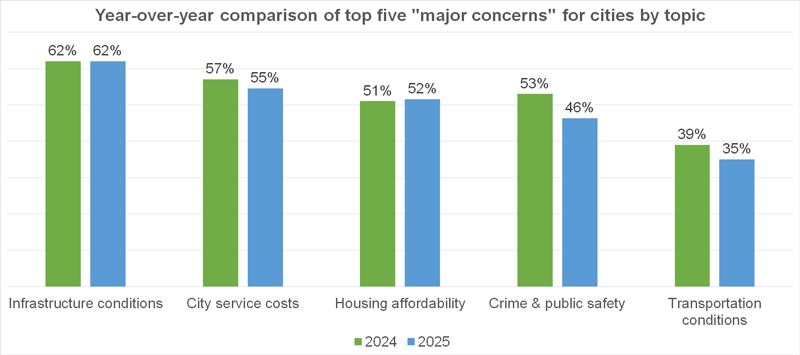
Responses to this year’s survey aligned closely with our 2026 City Legislative Priorities, with cities highlighting acute needs around transportation and infrastructure, public safety, housing supply, and the costs required to provide these vital city services.
Notably, cities' major concerns followed a similar pattern to last year's.
Sources:
2025 AWC City Conditions Survey, 167 responses
2024 AWC City Conditions Survey, 151 responses
Finance
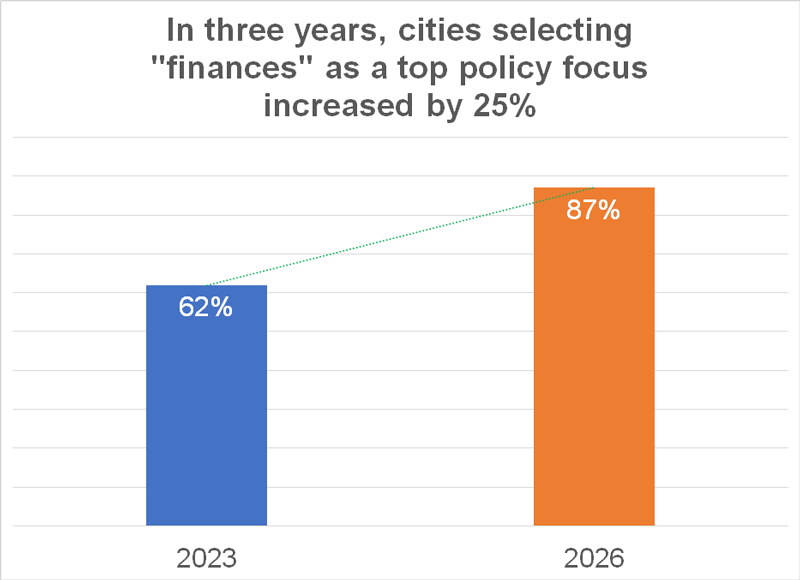
Our survey revealed a stark rise in concern for city budgets over three years: 25% more cities selected finances as a top priority for the next year.
Sources:
2025 AWC City Conditions Survey, 172 responses
2022 AWC City Conditions Survey, 86 responses
While there are several contributing factors (such as the ending of one-time federal ARPA funds), the compounding math problem remains the same: The rising cost of providing services outpaces the revenues needed to pay for them.
More than half of city respondents reported that revenues are falling short of expenditures:
- 94% said increasing costs are a contributing factor.
- 54% said long-term structural challenges are as well.
The 1% property tax cap does not let us keep up with inflation.
– Town administrator
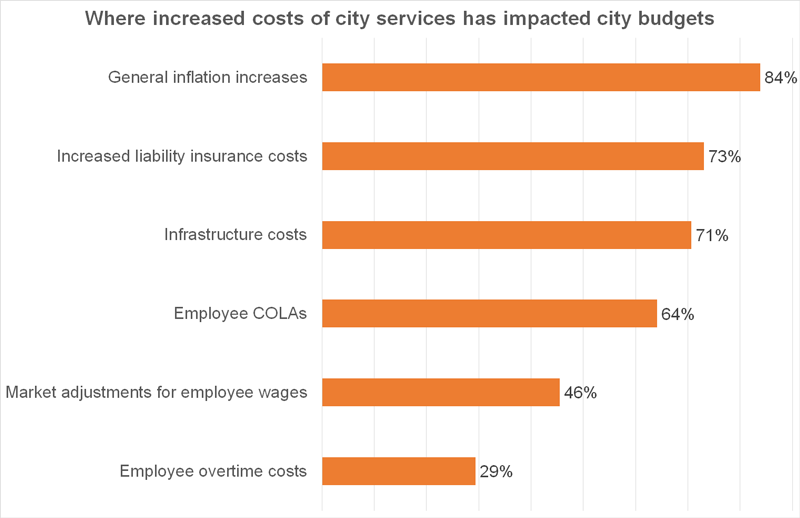
When asked specifically about the increased costs, the large majority of respondents listed general inflation, liability costs, infrastructure costs, and employee cost-of-living increases.
Source: 2025 AWC City Conditions Survey, 167 responses
To address the shortfall, 93 cities that responded said they would turn to:
- Increasing revenue (65%)
- Using operating reserves (58%)
- Canceling or postponing capital projects (46%)
- Reducing or eliminating programs (38%)
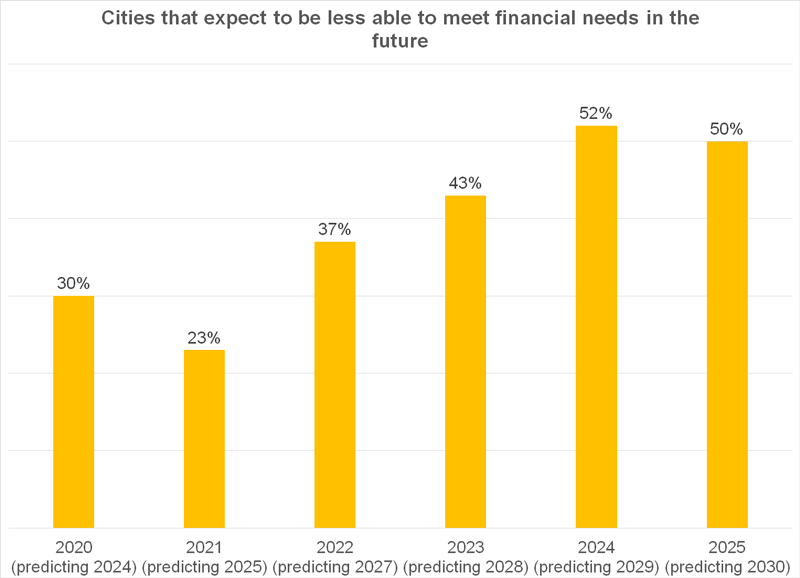
Ultimately, 50% of cities say they expect their city to be less able to meet their financial needs in the next five years. That’s up from a low of 23% of cities that said the same in the fall of 2021 when asked to look forward to 2025.
Sources:
2025 AWC City Conditions Survey, 162 responses
2024 AWC City Conditions Survey, 147 responses
2023 AWC City Conditions Survey, 141 responses
2022 AWC City Conditions Survey, 81 responses
2021 AWC City Conditions Survey, 123 responses
2020 AWC City Conditions Survey, 122 responses
Housing
Affordability of housing continues to be a major concern of most city leaders responding to the survey. It also ranks as one of the top five areas for which more than half of responding cities would like to see increased state funding.
As cities plan for and accommodate shelter, transitional, emergency, and permanent supportive (STEP) housing in their comprehensive plans, it’s clear that state intervention will be needed to encourage developers to build this type of subsidized housing.
- Only 32 cities reported receiving at least one complete permit application for STEP housing in the last three years, and only one of those received more than 10 applications.
- Of the STEP projects built or under construction in the last three years, most cities responded that 51-100 beds or units will be provided per project.
- When asked about denials of a complete permit application, only two cities indicated that they denied an application.
Infrastructure
For the fifth year in a row, responding cities overwhelmingly reported that infrastructure is a top priority. Seventy-nine percent selected infrastructure as their top concern in 2026, while 62% identified the condition of their infrastructure systems as a major concern. Specifically, when asked to identify their most pressing infrastructure challenges, respondents cited the following four:

Few cities can cover the costs of their needed infrastructure projects without relying on outside assistance. This year, only 37% of respondents indicated that they can fund more than half of their planned projects with city revenues alone. Forty-two percent reported that they can cover only up to a quarter of their infrastructure projects with their own revenues, showcasing the need for state and federal funding and private development.
When asked to indicate the top five areas for which they would like to see increased state funding, 75% of respondents selected traditional infrastructure, while 68% selected transportation infrastructure, demonstrating a pressing and widespread need among cities for state assistance in maintaining local systems.
High costs are not the only challenge cities face in caring for their infrastructure systems. Public bidding and contracting requirements often present barriers to project completion, along with state- and nationwide trends in the economy and construction industry. Survey respondents report the following challenges as the most impactful to their infrastructure projects:
- Materials costs and supply chain issues
- Shortage of responsive bids
- Poor quality of lowest-responsive bidder
- Amount of staff time required
- Delays at state and federal agencies
State policies that promote competition and streamline the procurement process are needed to ease the burdens on public owners and facilitate project completion in a timely and cost-effective manner.
Transportation
Developing and maintaining local transportation systems is an important city responsibility. In addition to transportation maintenance and preservation, cities and towns prioritize traffic safety, multimodal access, and carbon emissions reduction.
This year, about 58 % of respondents indicated that they source transportation expenditures from the city’s general fund. But local dollars can only go so far. Forty percent of Washington’s cities have an annual transportation budget under $250,000, and half have an annual transportation budget under $500,000.
In 2025, the following results stood out when responding cities were asked to identify their top five transportation needs:
- Maintenance and preservation of current assets (87%)
- Improving and constructing sidewalks (70%)
- Improving traffic safety (47%)
Limitations on transportation funding are rooted in the state’s budget structure and become apparent when the state suffers a budget deficit. Given cost escalations in recent years and the high cost of maintenance and replacement—along with future uncertainty, particularly at the federal level—securing long-term, sustainable revenue sources for local preservation, maintenance, and operations is among the most challenging funding puzzles that cities face.
Public safety
Public safety remains a priority for cities, especially around funding. The percentage of cities selecting crime and public safety as a major concern came down seven points compared to last year (tracking closely with what we see in regional and national crime trends). Still, 52% of survey respondents (82 cities) reported increases in law enforcement calls for service in the last year. Of those cities:
- 76% said property crime calls increased;
- 57% said calls for other crimes (assault, etc.) increased;
- 56% said calls for drug-related crimes increased; and
- 51% said calls for welfare check/behavioral health crisis assistance increased.
The cost to provide public safety services continues to rise. To fund public safety needs, 76% of respondents expect to increase their public safety spending in 2026, and of those, 22% of respondents said spending will increase by more than 10%. Notably, this is a similar finding to last year, indicating that rising public safety costs continue to strain city resources.
Source: 2025 AWC City Conditions Survey, 88 responses
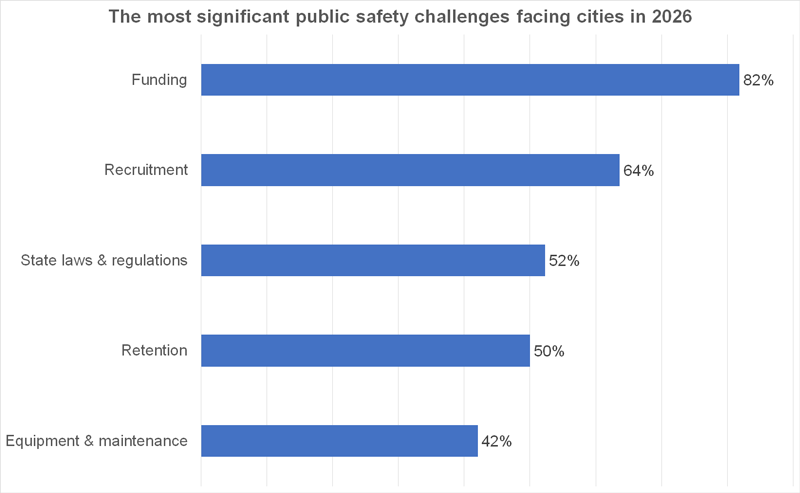
Looking ahead, the majority of respondents selected funding as one of the most significant public safety challenges in the next year. Not surprisingly, 80% of cities said they’d like to see increased state funding for public safety.
HB 2015
The 2025 Legislature enacted HB 2015, which established a new 0.1% councilmanic sales tax and $100 million grant program for local governments. While the Criminal Justice Training Commission (CJTC) is working to set up parameters for both options with policy and training requirements, cities are eager to get access to the new funding sources.
When asked about their intent to pursue the new funding, 71 cities indicated that they plan to apply for the grant, adopt the sales tax, or do both. When cities said they are not planning to do either option, the top reason was because they don’t have enough information and understanding of the funding. Some cities said they were still considering it and are waiting on results from local measures on November ballots. Very few cities said the training and policy requirements were a deterrent.
Indigent defense
In June 2025, the Washington Supreme Court ordered lower caseload limits for public defenders over the next decade. The new order will cut caseload standards by an estimated two-thirds for each public defender by 2036.
In response to the new standards, we asked cities about their plans.
- 15 cities reported that cases have already been dismissed in 2025 because they could not provide a public defender.
- 17 cities reported that their prosecutor’s office has changed its charging practices due to inadequate defense services.
- 53% of respondents reported that the city will need to either renegotiate contracts or contract with additional attorneys to meet the new caseload standards.
Workforce
Although, like last year, the majority of respondents said their city is not experiencing higher-than-normal vacancies, cities continue to report that police and public works positions are the most challenging positions to fill. The top three workforce challenges are budget constraints (65%), negotiating collective bargaining agreements (40%), and compliance with changing federal and state employment and labor laws (37%).
Artificial intelligence
Only 14% of respondents confirmed that their city is using AI tools. Most of these cities have a population of more than 10,000 residents. However, 33% of respondents indicated that their city plans to adopt AI tools in the coming months.
The top five ways respondents are using or plan to use AI tools are as follows:
- Drafting and writing assistance (76%)
- Creating documents, policies, or correspondence (69%)
- Research assistance (68%)
- Document summarization (54%)
- Note taking, recording, or summarizing meetings (51%)
More than half of responding cities are not using AI tools and cited the following reasons:
- 58% said that they do not see an immediate use for AI at this time.
- 44% noted concerns about accuracy and reliability of results, as well as the unclear regulatory environment surrounding AI tools.
- 40% raised concerns about data privacy and public records implications.
Results dashboard
Explore current and past City Conditions Survey results in our new data visualization dashboard.