In the fall of 2023, we surveyed Washington’s cities and towns to learn about current city conditions. Read a snapshot of what we learned.
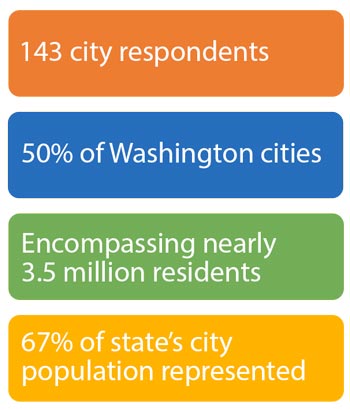
Who took the survey?

What we found
General city conditions
Here are the four main takeaways from the 2023 City Conditions Survey (CCS):
- Closely aligned legislative priorities: Responses to this year’s survey aligned very closely with our 2024 City Legislative Priorities, with cities highlighting acute needs around public safety, infrastructure, behavioral health, and revising the arbitrary 1% property tax cap.
- Post-pandemic concerns remain: Cities are feeling less pressure on direct pandemic-related concerns we’ve experienced since 2020, however cities are largely still dealing with the high costs of business and finding the right workforce to do the job.
- Infrastructure looms large: Despite historic and significant investments from federal and state partners in the last year, city infrastructure costs still outpace resources. Preservation and maintenance of local infrastructure systems remain vital as those systems continue to age and require ever-present investment.
- Future finances are top-of-mind for cities: Cities face ongoing structural issues where city revenues are outpaced by increasing costs of goods and services. Cities need flexible, sustainable, and reliable revenue options to meet the needs of our unique communities.
2023 was a big year for increased funding, both for housing and the Public Works Assistance Account. Cities are pleased with those accomplishments, yet survey results indicate that cities have been negatively impacted by inflation in a variety of ways and that there is still significant uncertainty around city budgets.
In fact, these concerns are shared by cities nationwide. According to the National League of Cities (NLC) 2023 City Fiscal Conditions Report, prices, inflation, infrastructure needs, and employee wages and salaries were among the factors having negative impacts on city budgets. The report also indicated that only about 50% of finance officers are optimistic about balancing budgets for fiscal year 2024. (Page 19)
The same challenges are reflected in locals’ concerns for the conditions of their community. In AWC's CCS, when asked to indicate which issues their community identified as a “major concern,” city respondents identified:
- Increased costs of city services
- Crime and public safety
- Conditions of infrastructure systems
- Affordability of housing
- Availability of behavioral health and substance use disorder treatment resources
- Conditions of the transportation system
While concern over community conditions is still high in many of these areas, major community concerns appear to be trending slightly downward over three years, with the exception of crime.
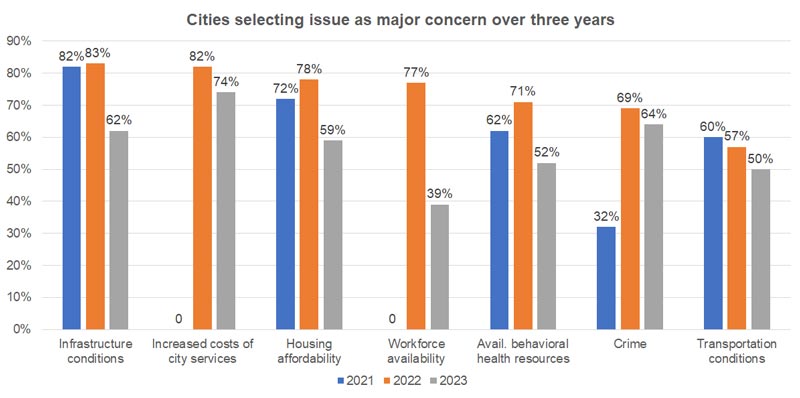
Sources: 2023 AWC City Conditions Survey, 143 responses*
2022 AWC City Conditions Survey, 87 responses
2021 AWC City Conditions Survey, 124 responses
The same concerns appear again in the top policy issues cities identified for 2024:*
- 78% of cities indicated city budgets and financing as a top policy issue;
- More than half of cities anticipate that revenues would fall short of expenditures; and
- 86% of cities listed infrastructure as a high-priority policy issue.
Top policy issues for 2024 reflect a steady trend over four years. Notably, infrastructure policy is at an all-time high over four years. Similarly, public safety, city finances, and economic development remained high compared to prior years. (Note: City finances was not on the list prior to last year.)
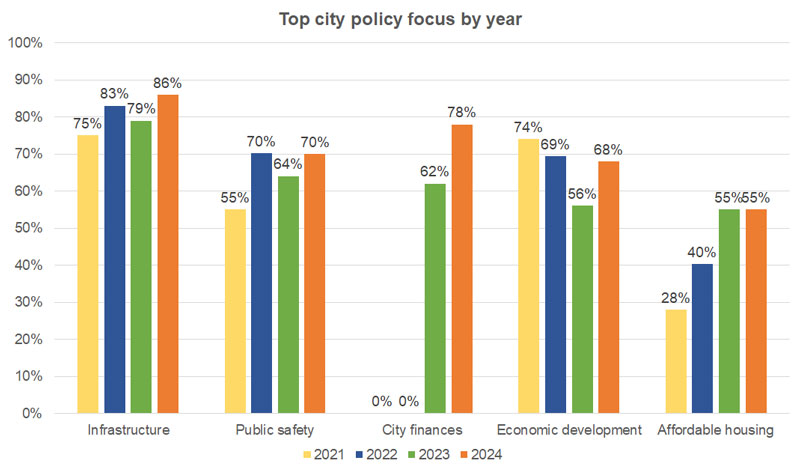
Sources: 2023 AWC City Conditions Survey, 139 responses*;
2022 AWC City Conditions Survey, 86 responses;
2021 AWC City Conditions Survey, 124 responses;
2020 AWC City Conditions Survey, 118 responses
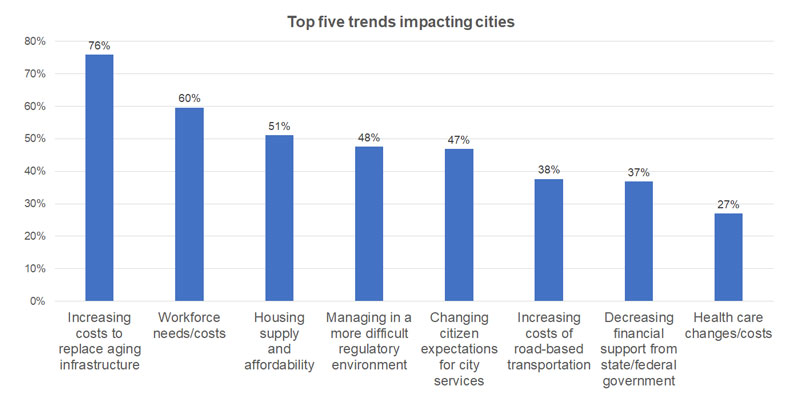
When asked to identify the most significant financial trends affecting their city’s ability to govern in the next five years, respondents said:
- Increasing costs to replace aging infrastructure (76%);
- Costs and needs for workforce (60%); and
- Affordability and supply of housing (51%).
Finally, cities largely concur on how the state could best support their work, with infrastructure consistently leading the list of needs for 85% of cities*. In close alignment with our 2024 City Legislative Priorities, more than 50% of survey respondents say they would be helped by:
- An increase in state funding to local governments for infrastructure and transportation (85%);
- Increasing current state-shared revenues (71%);
- A revision to the 1% property tax limit (64%);
- Enhancing state funding for public safety and criminal justice (62%); and
- Increasing state investment community-based crisis response and behavioral health resources (52%).
Cities are innovators and collaborators—and we know we can’t do it alone. Cities need consistent, dedicated solutions not only to plan for future growth, but to maintain the quality of and access to needed services. This is the case not just across the state, but as NLC points out, across the nation:
“Looking ahead, municipal governments remain vigilant about their approach to balancing their budgets, mostly due to budgetary pressures and costs associated with hiring and retaining their workforce and meeting infrastructure needs.” (Page 7)

Finance
Finance struggles persist, with revenue expenditure imbalance
Structural challenges in city finances and increasing costs due to inflation continue to vex cities. At 99%, nearly all cities cited increased costs as a concern in their community. Further, 74% of cities reported increased costs of city services as a major concern.
78% of cities identified city finances as a top five policy issue for 2023, up from 62% in 2022.
78% of cities identified city finances as a top five policy issue for 2023
Looking ahead to 2024, 76% of cities do not expect a revenue decline, but:
- 51% reported that revenues will not keep pace with expenses; whereas
- 32% reported the same last year.
Looking ahead to 2028, 43% of cities also expect they will be less able to meet financial needs in the next five years.
How does your current revenue outlook compare to your expenditure outlook for 2024?
- Revenues exceeding expenditures (8%)
- Revenues generally keeping up with expenditures (41%)
- Revenues are falling short of expenditures (51%)
80% of responding cities reported that revenue-expenditure imbalances were driven by inflation increasing costs, and 67% of cities also cited structural challenges as a driver.
Property tax revenues are a major factor in why revenues cannot keep pace with costs
One of the major structural challenges is the two decades cities have had an arbitrary limit on property tax revenues. 64% of cities support revising the arbitrary 1% property tax limit to one based on inflation, which would help keep pace with costs of services. 71% of cities also identified support for increasing state shared revenues.
64% of cities support revising the arbitrary 1% property tax
Impact of increased costs on city services
Major drivers of increased costs include basic city services and issues identified as the greatest needs, including infrastructure costs, employee costs like COLAs, keeping pace with market wages, and workforce retention.
The major impacts of increased costs on city services reported by cities include:
- 81%: infrastructure costs
- 61%: employee COLAs
- 51%: market adjustments for employee wages
- 44%: vehicle fuel costs
- 37%: workforce turnover & retention
- 16%: employee overtime costs
- 10%: Other such as liability, law enforcement contracts, costs of goods & services
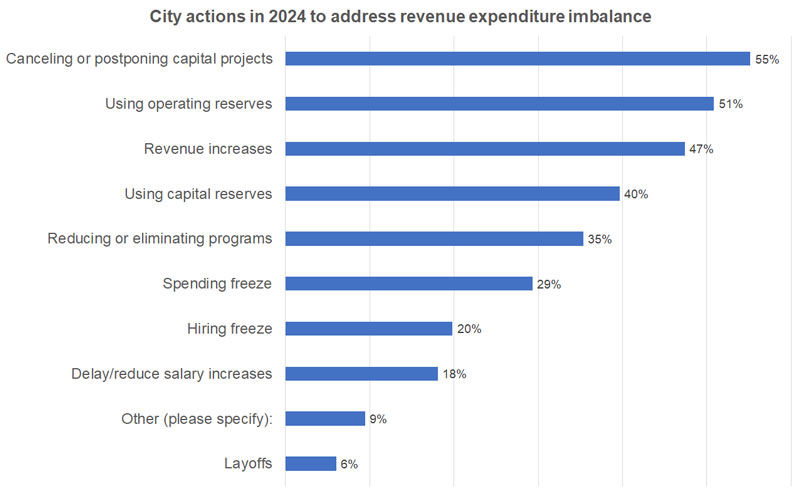
City actions to respond to the revenue expenditure imbalances only provide temporary solutions and compound other needs and challenges for cities, like postponing investments in infrastructure and implementing hiring freezes.
Actions responding cities will likely take in 2024 to address revenue - expenditure imbalance:
Trends impacting the future of cities
Looking to the future, cities identified similar issues as trends impacting the future of cities, including infrastructure, workforce challenges, and housing. But they also identified other conditions impacting operations, like changing community expectations, the regulatory environment, and decreasing federal and state support.
State support and a property tax fix were identified as two main solutions the state can provide to assist cities in meeting the needs of their communities.
- 71%* of cities support increasing current state shared revenues
- 64%* of cities support revising the 1% property tax limit

Housing
A significant percent of cities cites housing affordability as a major concern—including nearly 80% of cities over 10,000 in population. The state has identified the need for over 650,000 housing units in the next 20 years for those in our communities making low to extremely low incomes. When asked if the real estate excise tax (REET) is an appropriate source of new revenue for affordable housing, 82% of respondents were in favor of linking these revenues to support housing needs, with the majority supporting more flexibility with existing local REET revenue or creating a new local REET option.

Infrastructure
Infrastructure remains the top policy priority for cities across the state, for the fourth CCS in a row. The conditions of city infrastructure systems present a “major concern” to most cities. Specifically, the top five challenges as we head into 2024 are:
- Impact of inflation on bids and materials costs
- Age and state of water and wastewater infrastructure and facilities
- Lack of available contractors and workforce
- Challenging federal grant and loan requirements
- Cost of necessary infrastructure investment
Cities prioritize maintaining and building their infrastructure systems.
Despite these hurdles, cities prioritize maintaining and building their infrastructure systems. Their main funding sources are utility revenues, general fund revenues, REET, and impact fee revenues. However, city-generated funding is typically not enough. Approximately 40% of cities* rely on federal and state sources to fund projects. But even state and federal funding levels come up short. After accounting for the city contribution, over 70% of cities* report that state and federal funding sources do not meet their infrastructure funding needs. In fact, just as many have deferred maintenance on infrastructure projects due to funding constraints in the last five years.
70% of cities report that state and federal funding sources do not meet their infrastructure funding needs.
Limitations on infrastructure funding are rooted in a statewide structural deficit. Along with cost escalations in recent years and the high cost of maintenance and replacement, the lack of long-term, sustainable revenue sources to fund maintenance and operations is among cities’ primary funding challenges.
Maintenance and preservation are the top priority, as identified by a staggering 83% of cities.
We see a similar picture when turning to transportation, where maintenance and preservation are the top priority, as identified by a staggering 83% of cities.*
- Providing pedestrian access and safety is their second transportation priority for 2024;
- Followed by multimodal access and safety, and new or increased capacity.
The Transportation Improvement Board (TIB) continues to be a lifeline to city transportation systems. TIB is the top funder of city projects. City general fund revenues and WSDOT Local Programs awards follow as the other primary sources of transportation funding sources.
Cities have identified the importance of access to affordable and reliable broadband for their residents, and recognize that broadband is key to economic growth, healthcare and education access, and connectivity to other necessary support services. 70% of survey respondents report needing affordable rates with predictable and reasonable cost adjustments to increase access to reliable broadband services.

Public safety
Public safety continues to be a top priority for cities across the state.
- 58% of cities reported an increase in crime over the past year, particularly property crime and drug possession;
- 62% of cities plan to increase public safety funding over the previous year; and
- 18% of cities plan to increase public safety funding by more than 10%.
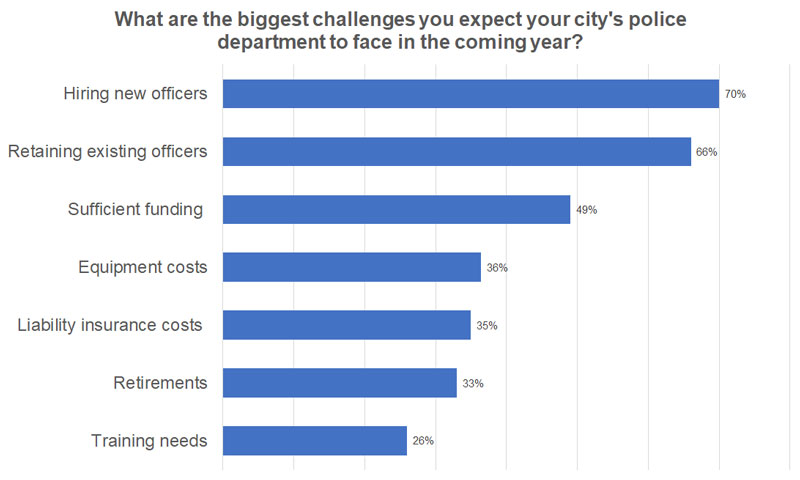
Recruiting and retaining police officers to ensure sufficient law enforcement staffing coverage continues to be a challenge. 70% of cities expect hiring new officers to be one of their biggest challenges in the coming year, while 66% say that retaining officers and 33% say that retirements are the biggest challenge. This is true even though cities are offering financial incentives:
- 42% of respondents are offering financial hiring incentives for lateral transfers;
- 29% of respondents say they offer financial incentives for new hires; and
- 24% of respondents offer financial incentives for retaining existing officers.
Cities have reported that law enforcement officers are increasingly being dispatched to behavioral, mental health, and substance use crisis. A number of cities are adopting alternative response programs that complement or replace a traditional law enforcement response with one that takes a holistic approach to an individual’s needs:
- 25% of respondents have an arrest and jail alternatives program (e.g. Law Enforcement Assisted Diversion or LEAD);
- 39% of respondents pair a behavioral health or mental health co-responder with law enforcement when appropriate;
- An additional 19% of cities* have fire-based co-responders (e.g. CARES); and
- 16% of responding cities operate mobile crisis response.
Additionally, 25% of responding cities offer pre-trial diversion and 27% of responding cities operate a therapeutic, community, or substance use disorder court.

Human resources
The last several years have seen cities struggle to fill open vacancies in the wake of the COVID-19 pandemic and following “Great Resignation.”
This year remains a tough labor market for cities, though slightly lower than in 2022.
- In 2023, 67% of responding cities still say they are struggling to fill vacancies, compared to 72% last year.
Breaking down these 2023 responses further, difficulty in hiring is especially pronounced for our larger cities:
- 93% of large cities reported difficulty (50,000+ population);
- 88% of medium-sized cities reported difficulty (5,000–50,000 population); but
- Only 36% of small city and town respondents reported difficulty (less than 5,000 population).
As city HR departments already know, the difficulty of recruiting is not evenly spread across the city workforce. The top departments that cities struggle to recruit for have been consistent for several years. Police, public works, and general government top the list among this year’s respondents:
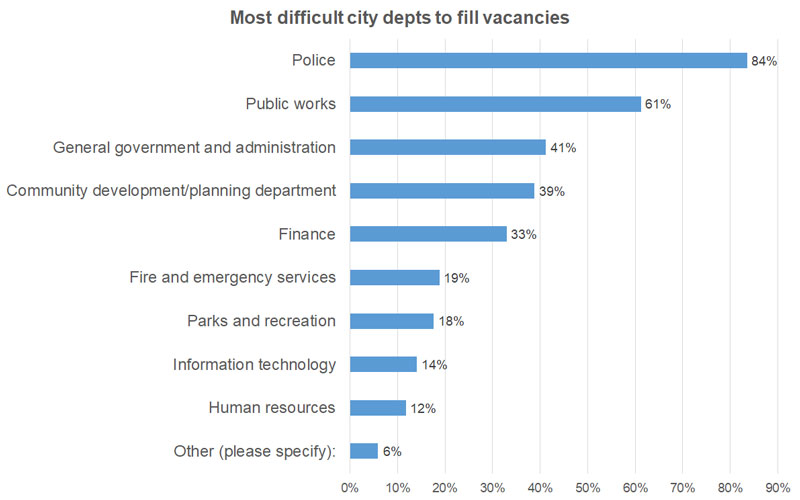
To address recruiting challenges, some cities are trying different incentives to entice workers to hire on or remain with cities.
- 56% of responding cities were offering some kind of incentive (hiring bonuses, premium pay/raises, remote work, etc.) to either attract new workers or keep old ones.
- 26% of responding cities reported that they were offering remote work.
Notably, this year only 35% of responding cities reported that they were experiencing a higher-than-normal number of retirements and resignations over the past year, down from 47% in 2022. Unsurprisingly, cities reported that the departments most impacted by retirements and resignations were also largely the ones hardest to recruit for, including:
- Police;
- Public works;
- General government & administration; and
- Finance.

Diversity, equity, and inclusion in cities
Cities continue the important work of incorporating diversity, equity, and inclusion (DEI) initiatives and thinking into their everyday operations.
- 47% of respondents reported that their city elected and appointed officials have participated in and support continued conversations about DEI;
- 42% of respondents have taken the concrete action of incorporating an equity lens in their policy discussions and decisions; and
- 29% of respondents provide staff ongoing DEI training.
Similar to last year, close to 50% of survey takers either already have or are considering creating a committee focused solely on DEI. Of those that already have such a committee,
- 35% have an internal committee;
- 35% have both internal and external representatives on a DEI committee; and
- 29% have an external DEI committee.
We also asked cities what they are doing to incorporate DEI into their budgeting and policy process.
- Nearly 40% of responding cities use an equity lens in developing city infrastructure priorities and policies; and
- 32% use an equity lens for transportation priorities and policies.
Finally, 68% of respondents said that AWC can help their city develop equity focused policies by offering more trainings, and 64% want AWC to provide more resources for cities to use in developing their own DEI plans and polices.
*90% Confidence interval